back to projects
cal.pal
long-term productivity analytics for your google calendar
what is cal.pal? the idea + walkthrough
cal.pal analyzes your Google calendars and gives you insights on what types of activities you spend the most time on. First, you log in with your Google account through Google OAuth. Next, you select the time range and calendars you want insights for (cal.pal lets you choose from all the calendars you have read-access to). Then cal.pal groups all the events in this time range from the selected calendars by name, and prompts you to tag each of these event groups into categories. So for me, I might tag each of the individual meetups/meetings in my week under "meetings", and the recurring events "donk practice" and "ADT practice" and "MissBehavior practice" as well as single-occurrence performances under "dance", and all my class lecture and recitation times under "school". After tagging, cal.pal takes me to a visualization page for my insights: top event groups I spent the most time at, top tags I spent the most time at, etc. (I got inspiration for the insights I wanted us to offer from Spotify Wrapped). After seeing all the insights, you proceed to a goals page, where you can record what three tags you want to work on. For example, I might record that I want to spend 2 less hours/week in meetings in the next 2 weeks. cal.pal saves your goals for you so you can track how your productivity changes long-term.
the tech
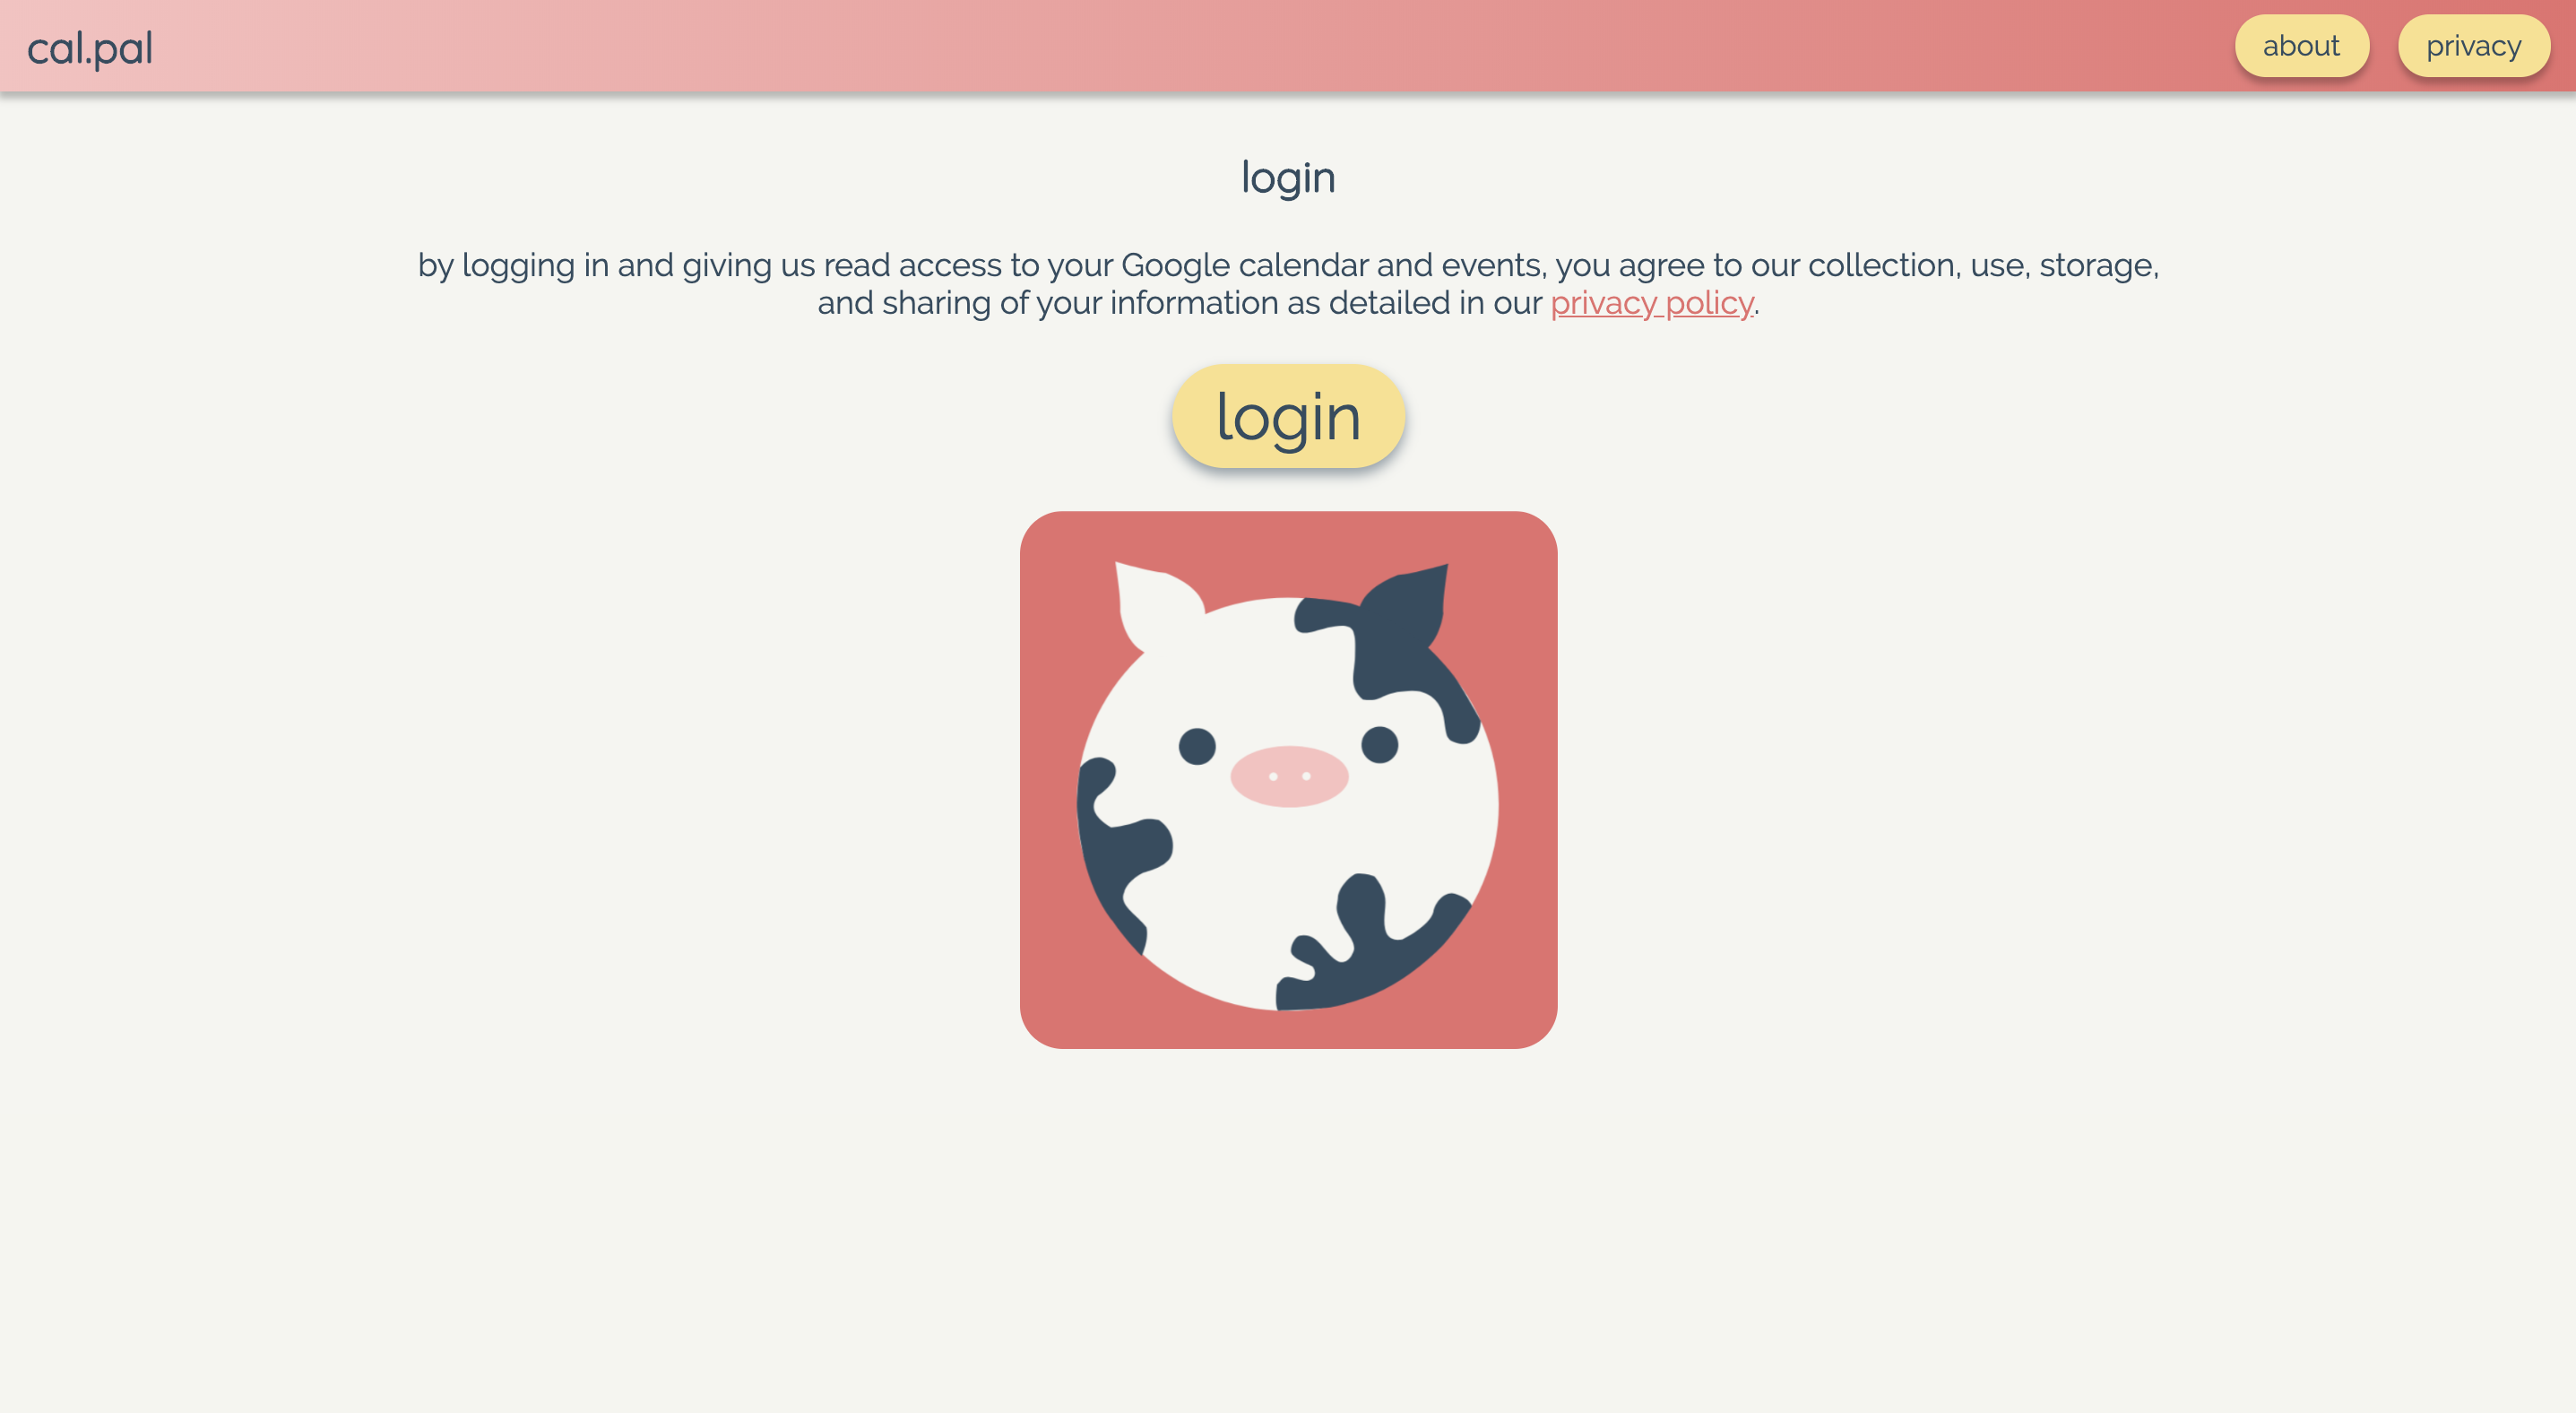
We wireframed the front end in Figma, and used React in our front end implementation. We also used Node.js for the backend, as well as MongoDB to store data, CanvasJS for insight visualization, and OAuth 2.0 for authentication. Our app is hosted on Heroku, and the Google Calendar API was pretty much the backbone of our project. Amber made our logo/favicon in Scratch.
problems, technical difficulties, and known bugs
Well. For an app that's supposed to give you insights, it sure isn't very insightful. That's because during the competition time period we had so much trouble with the other problems/bugs (see: the rest of this section) that we had very little time to implement all of the insights we had intended to do.
We had a lot of trouble hooking up OAuth, because we needed some special permissions to access calendar data. At one point we even thought we had to become verified by Google, which is at least a 6-week-long process, aka too long of a time frame for web.lab. Eventually Amber got the app permissions working, though first-time users always get a very angry-looking THIS SITE IS NOT SAFE warning from Google. We're harmless though, I promise. Just click "advanced settings" and "proceed to site" to authenticate and log in.
One known bug is if you select a combination of time range and calendars that don't have any events in them, our app crashes. The reason this isn't a quick fix is because the way our components are set up in relation to each other makes catching this error kind of hard.
We also had a weirdly hard time finding visualization libraries that offered the great presentation we were looking for and could use the types of data we were collecting. CanvasJS did the job but the docs are...not great. It doesn't seem to be maintained well, and there's a paywall, which means some useful functionalities are behind the paywall. >:(
future work
Fixing the existing bugs, of course. Then adding all the insights we'd intended to add, and possibly transitioning into using another visualization library for resilience.
team: Amber Li
context: made for web.lab competition
context: made for web.lab competition